Water flow as a cause of spikes in development
Empirical observations for scientific enquiry, knowledge and improvement in Alternative Photography.
This article is for experienced and advanced users
What are spikes?
Spikes are sudden bumps in values, reading a step tablet test print used to calibrate a printing process. Spikes are detectable between the end of one row and the beginning of the next in a 101 or 256-step tablet.
Introduction
I had already written a first article about spikes affecting the calibration of digital negatives, that you can read here. I had made many tests, ruling out many possible variables and causes of spikes, leaving only space for the water flow to be the cause.
I have now used a new empirical method as a systematic approach to acquiring knowledge through observation, experimentation, and data analysis.
What I wanted to determine is that there is an increased water flow around the edges of a print compared to its centre, when you wash a print into a tray. That water flow creates loss of density (colour). The quantity of density loss may depend on several factors including the strength and pace of rocking the tray (water flow rate), the dimension of the print compared to the dimension of the tray, all of which affects how the water flows over and around the print.
This “over wash” of the edges is not really visible to the naked eye on a photographic print, but it becomes evident if you are test printing a step tablet in your alternative photographic process. That density loss at the edges will be revealed as a spike on the density values when reading the sequence of those steps.
Unfortunately, a strong spike can alter the calibration of your digital negative, and you must know how to deal with any spiked values if you are manually creating your correction curves.
The solution is to avoid or minimise any density loss, so as to avoid the creation of spikes in the test print of step tablets.
The following, describes how I approached the problem, my empirical working system, complemented by a video that shows the design of the experiment and the final results.
Problem and Hypothesis
Problem: Spikes, as areas of density loss around the print of a step tablet in alternative photographic processes.
Hypothesis: Increased water flow at the edges of a print, during the washing process, leads to increased density loss.
There is no literature on the subject, and to get all the possible information I asked many experienced print makers their experience about spikes, so that I could refine my hypothesis and methodology.
Designing the Experiment
Variables
• Independent Variable: Water flow rate (e.g., low, medium, high), ratio between paper and tray dimension.
• Dependent Variable: Density loss in prints.
• Controlled Variables: Type of prints, consistent coating, duration of washing, temperature and pH of water, type of washing equipment, water speed.
Materials
• Prints (identical samples to ensure consistency).
• Water flow control equipment (water pump, closed circuit into a tray, flow attenuation).
• Scanner and a photo editor to measure print density.
Method
1. Record videos to measure water speed: rock a tray full of water containing a print while recording 4K videos at 60 fps.
2. Calculate water speed: during video editing, mark the start and the end point of water waves over the centre and over the edge of a print. Calculate water speed in both areas counting the number of frames for a full course of a wave. Mark and calculate it on many waves of the video for consistency.
3. Calculate two slope angles: To make new wash tests, use a sloped system to reproduce the two water speeds just calculated.
4. Make a controlled washing system: prepare a plexiglass panel with a system for water flow attenuation, a system for changing the panel inclination so as to increase speed, and a system for consistent water flow emission at origin.
5. Prepare Test Sample: coat a large sheet of paper, let it dry.
6. Expose the coated paper: Give an exposure shorter than the Standard Exposure Time in order to obtain a medium density, easier to measure, and cut two central stripes for consistency in coating quality.
7. Control Conditions: Ensure that other variables like water pH and temperature and washing duration are kept constant across the two washing tests.
8. Wash Prints: Subject both prints to the assigned water flow rate for 20 minutes. Set the specific slope for test n.1 and change it for test n.2 as defined.
9. Measure Final Density: After washing, let it dry for one day, scan the two samples with a control grey card, and measure the final density of each print using Photoshop.
10. Record Data: Document the density measurements and compare them with a spiked step tablet test print.
Conducting the Experiment
• I recorded a few videos while rocking a tray containing water as I would do to wash one of my prints. One video just rocking plain water, a few videos with a print in it, a few videos using floaters over the print.
• I edited the videos, marking the point where a water wave started its flow down a print and the point where it finished. I did it for the edge of the print and for the centre of the print. I repeated these markings multiple times to have an average speed at the edge and at the centre.
• The speed was 20% faster at the edge compared to the centre as average.
• There is also a higher quantity of water moving around the edges.
• To reproduce the different speed of the water, I created a sloped panel with water flow control, with two different inclinations. The velocity of water flowing down a slope can be approximated using the Manning equation. I reproduced the flow on the centre of a print on a 10º slope for the first test strip, then raised to a 14,5º slope for the second test strip reproducing the water flow at the edge of a print, and doing so it raised water speed by 20% as the measure I have found with my videos.
• I coated a single sheet of paper using a rod and let it dry for one hour in the dark.
• I exposed the coated paper in my UV exposure unit for half of my standard exposure time so as to have a medium density, easier to measure. After the exposure I’ve cut two long stripes, taken from the central area of the coated paper for better consistency, and numbered them 1 and 2. I waited one hour for the sheets to dry.
• I left the stripe n. 2 in a dark place and washed the stripe n. 1 on my washing system set at the 10º slope for 20 minutes, then hung the washed paper to dry.
• I washed the stripe n. 2 on my washing system raising its slope at 14,5º, for 20 minutes, then hung to dry.
• More than 24 hours later, I scanned the two final print tests, together with a gray card, inside Photoshop I calibrated the digitized image with the card values and desaturated the image to measure the RGB values of the two print tests as you would do to read all the steps of a step tablet test print.
Data Analysis
Calculated Density Loss: Test print n. 1 has an RGB value of 95 while test print n. 2 has an RGB value of 103, with a density loss corresponding to 8 in RGB value.
 Caption: the graph above with blue bars shows the values of my two empirical tests (as representing one spike).
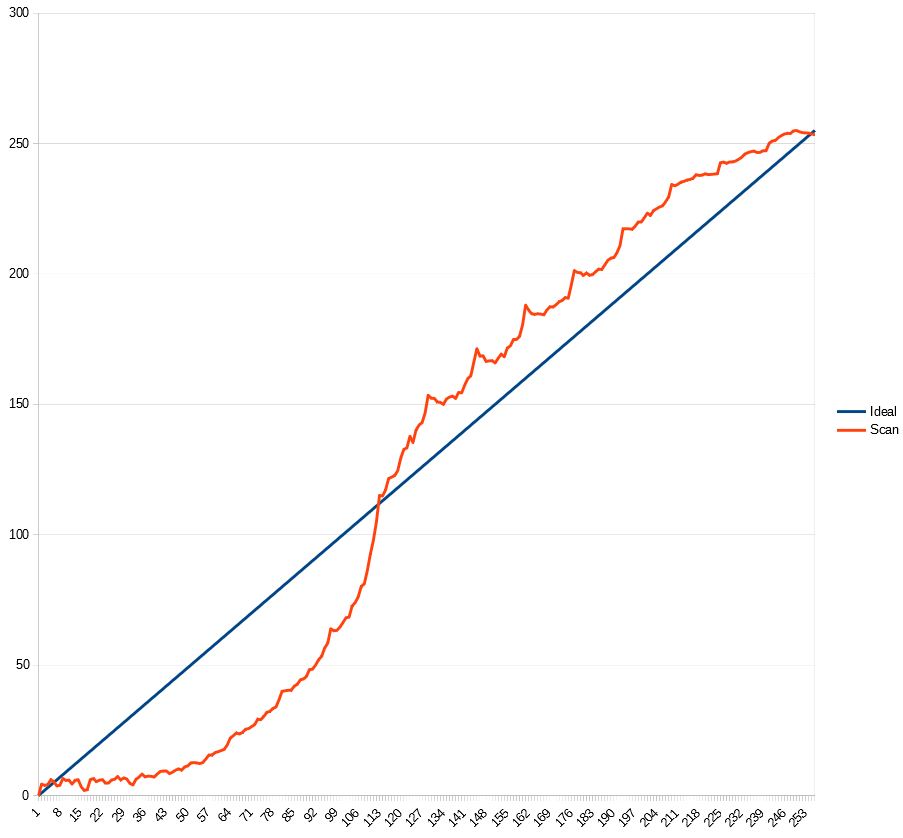
 Caption: the graph above with the red spiked line shows the values read from a print test with average spikes, of a 256 step tablet.
The values of the 256 step tablet test print shown above, show sudden changes in RGB values (spikes) of the order of 6 or 7 (e.g., difference in value from 151 to 158, from 212 to 218).
The values of my empirical test might change if the printed color (density) would be lighter, printing with a shorter exposure time, the values can also change if my wash test would be stronger, washing faster, etc.
In fact, in another test print I had made a long ago of a similar 256 step tablet, I could read higher spikes, with RGB differences of the order of 15 or 20!
Conclusion
Following this empirical method, I systematically tested and analysed the impact of water flow on print density. This method ensured a reproducible approach to determining the causes of density loss, and contributing to a better understanding and potential improvements of alternative photographic processes. This test was made considering an average situation, it can show higher or smaller values in other tests, but the fact is that washing a print into a tray creates spikes because of water flow differences between centre and edge of the print.
The format of the step tablet to avoid spikes is important. The most affected step tablets are the classic square format with 101 or 256 steps. To avoid the spikes you need to use special randomized step tablets with redundant values, like those used in the PiezoDN or BTNS calibration systems, or the new anti-spike 256 step tablet available inside the video course Digital Negative for Alternative Photography. As an alternative, to avoid spikes you can print your step tablets on a sheet of paper way larger than needed so that the over-wash will mostly happen over an unprinted area.
Video
I have shared my approach and test execution through the video herein included, of which this article is the complementary discussion.
